
From Firefighting to Focus: Building a Data-Driven CS Engine in SMB SaaS

GTM efficiency is critical and can be a moat in SMB SaaS. The best sales leaders are known to run their teams like a machine. Customer Success can do it too. In this post, I outline my learnings from revamping the CS team at JustCall (SaaS Labs), an SMB focused Contact Center platform. Using data, project management, and an iterative process, I aim to show how you can bring structure and a steady operating rhythm to your CS org.
Customer Success in SMB
CS for SMB is unique in a few ways. First, the average CSM handles a large volume of accounts, possibly 100 or even more. Second, the variation between accounts in a CSM’s portfolios increases over time. This happens because SMB software companies naturally tend to move upmarket as the product evolves and also because some customers grow faster than others. This means that there is almost always a meaningful variation in the account size/ revenue contribution and product needs between accounts in each CSM’s portfolio.

The above chart is a rough visual representation of this problem for the CS team. Each blue dot represents 5 customers. In year 1, CSMs have customers in their portfolio which are roughly the same ACV. But by year 3, the variation in ACV is much much higher.
This volume coupled with diversity in customers leads to a challenging environment for CSMs. Add to this, the fact that the smallest customers are the loudest and command a disproportionate amount of the team’s time. Teams are forever in firefighting mode, with no time left for proactive and strategic work that can actually make a dent in the company’s P&L.
How to bring focus and make time for strategic work?
Firefighting takes away time from activities that can actually get you better retention and higher expansion revenue. The most common solution to the firefighting problem is to bring in “data-driven playbooks” for CS using a software tool that is supposed to magically solve all problems. But as always, the devil is in the details of the design choices you make while executing this new way of doing CS.
In my experience, there are four pitfalls of making CS data driven
Pitfall 1: Using too many indicators to create a complex customer health score
Pitfall 2: Premature automation
Pitfall 3: Not making it dead simple for the team to do their work
Pitfall 4: Ignoring project management
Decide on a high signal metric
The first step in designing a data-driven engine for your CS team is identifying the right set of accounts for your CS team. Choose 1-2 high signal metrics that you can use to narrow down the set of accounts that are at risk of churning (accounts for retention) and that are growing more than expected (accounts for expansion). Beware of Pitfall 1 which is using too many indicators to create a complex customer health score. These scores typically have a lot of noise and are not great to actually identify accounts at risk or accounts which are promising for upsells and cross sells. More about this lesson on avoiding composite metrics here.
At JustCall I used MRR as the single metric to base all calculations on. It included both license and usage MRR, and theoretically had a strong enough correlation with both potential churn and expansion. We knew that customers who were at risk of churning typically reduced usage (calls and SMS) and more importantly, gradually reduced their subscription licenses before deciding to churn. And vice-versa, we knew anecdotally that customers who bought more licenses and/or increased usage were more likely to entertain our pitch to move to premium or buy add-ons.
Choose the appropriate frequency, thresholds and account tiers
Next, the goal was to make three design choices. First – at what frequency should I measure MRR movements? Should we look at weekly, fortnightly, or monthly movements? Ideally, we want to look at movements in real time but they are not often meaningful movements that warrant any action from us. Second – what should be the threshold for a movement (increase or decrease) to qualify as a signal? For example, a 1% decrease in MRR is not really a concern, whereas a 40% decline month on month would definitely be worth investigating. Finally, for which accounts do you want to run this exercise on? Do you want to exclusively focus on your tier 1 accounts (highest value accounts), or do you also want to include tier 2 and 3 accounts which are lower MRR.
With the help of a dashboard made by the data team, I downloaded weekly, fortnightly, and monthly movements in MRR in all our accounts. After multiple iterations, I narrowed down on fortnightly frequency with a threshold of 30% MRR movement, for all tier 1 and tier 2 accounts as the right design choice for this program. For each CSM, these filters mostly surfaced accounts which were genuinely worth working on.
Don’t automate too soon
Here, it is worth highlighting Pitfall 2 which is premature automation inside the CS org. If you look at CS software like Gainsight, Churnzero and the like, almost all of them have a product module which allows you to set a frequency and threshold of movement for a metric of your choice. The problem with using software to automate these alerts is that you really need to iterate and play around with multiple thresholds to see what makes sense for your product and customer base. It is not uncommon to see CSM inboxes littered with hundreds of these alerts which makes it extremely difficult for a CSM to actually investigate all the accounts rendering the whole automation useless. This is the idea behind Pitfall 2 – premature automation. During setup, I strongly recommend working with customer data manually on google sheets and getting a feel for whether the filters and thresholds you have used make sense for your team.
Make it dead simple for the team
Every two weeks, I would make a spreadsheet with all accounts which met the filters defined above : tier 1 and 2 accounts which had a 30% increase or decrease in MRR over the previous two weeks.
Then, I would add relevant additional information from the CRM/CS tool for these accounts so that everyone had the most amount of context. For example, the age of the account, name of onboarding manager, and previous comments from CSM. Finally, I would split the sheet into multiple tabs – one tab for each CSM with a list of accounts from their portfolio. The output looked something like this:
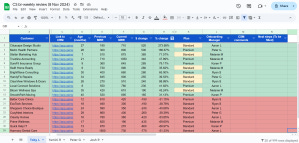
The screenshot above clearly charts out the accounts that Toby, a CSM, should focus on. The customers are listed in descending order of $ change in MRR. MRR increases are in green and decreases in red. In the other tabs of this spreadsheet, there are a similar set of accounts for the other CSMs in the team – Yamini, Peter, and Josh.
This view of accounts is essentially Toby’s to-do list for the next couple of weeks. He would investigate each account to understand what is actually happening. Are they changing their usage? If yes, why? Are they adding or removing user licenses? For the accounts in red, he would look at their support tickets, prior communications and try to alleviate any problems the customer would be facing. The accounts in green (especially those still on Standard plan) would be good candidates for a potential expansion opportunity.
Somewhat ironically, running this program out of a google sheet spreadsheet with color coded list of accounts made it super simple for CSMs to figure out what they should focus on and allowed us to avoid Pitfall 3 which is not making it dead simple for the team to do their work.In a world of distractions, it provided a simple to-do list for CSMs for the next 2 weeks which consisted exclusively of strategic and proactive jobs to be done. As opposed to working out of clunky software needing hundreds of clicks and with potential distractions in every part of the software, the spreadsheet is simple and clean. Importantly, it saved the team multiple hours of account planning and enabled them to focus on truly helping the customer.
Further, the ritual of the fortnightly call with all CSMs, where we started with previous week’s action items and ended with the next steps for the new set of accounts brought an operating rhythm to the team. This is how you can navigate Pitfall 4, by keeping a tight project management schedule around your team’s work ensuring the most important events in the most important customers are under control.
Controlling inputs is the first step to controlling outcomes
Following these steps doesn’t automatically guarantee an impact on retention and expansion. Much of that is still driven by the quality of your product and the industry you sell to. But setting an operating rhythm in CS that is actually based on customer data will definitely help you feel more in control of your team’s activities and inputs. Doing it consistently will pave the path to the outcomes that are so elusive in SMB SaaS – a world class net dollar retention.